What’s new
Feb 15, 2024
Feb 15, 2024
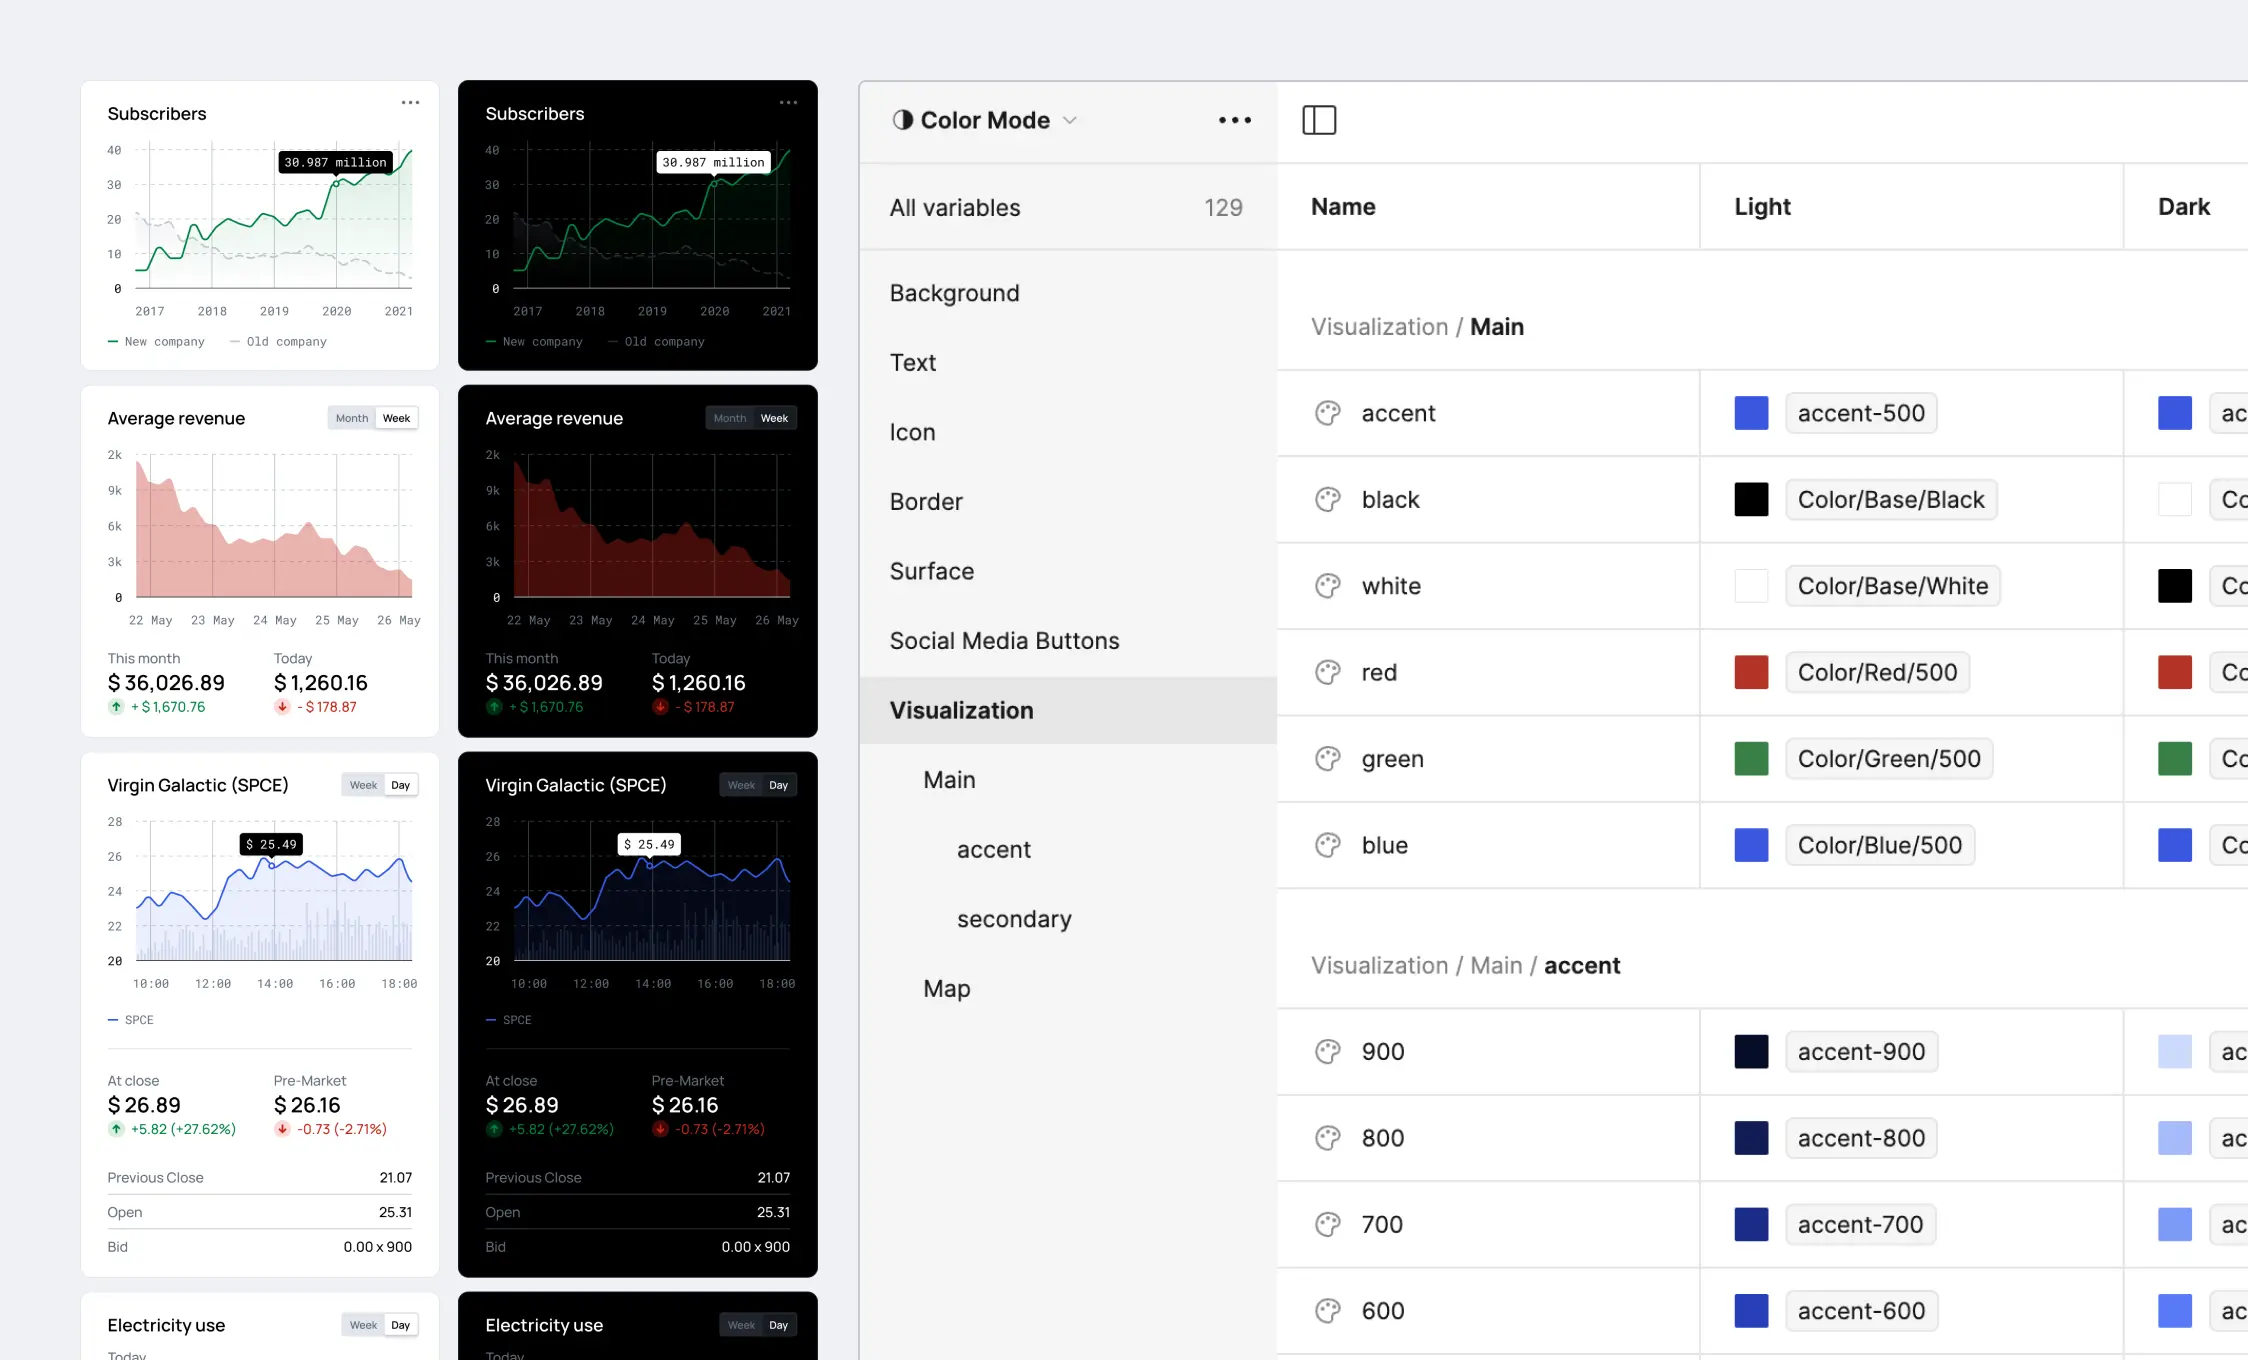
v3.0: Now with Variables
- Added Variables: Integrating variables (Primitives and Tokens) to save time and simplify design management.
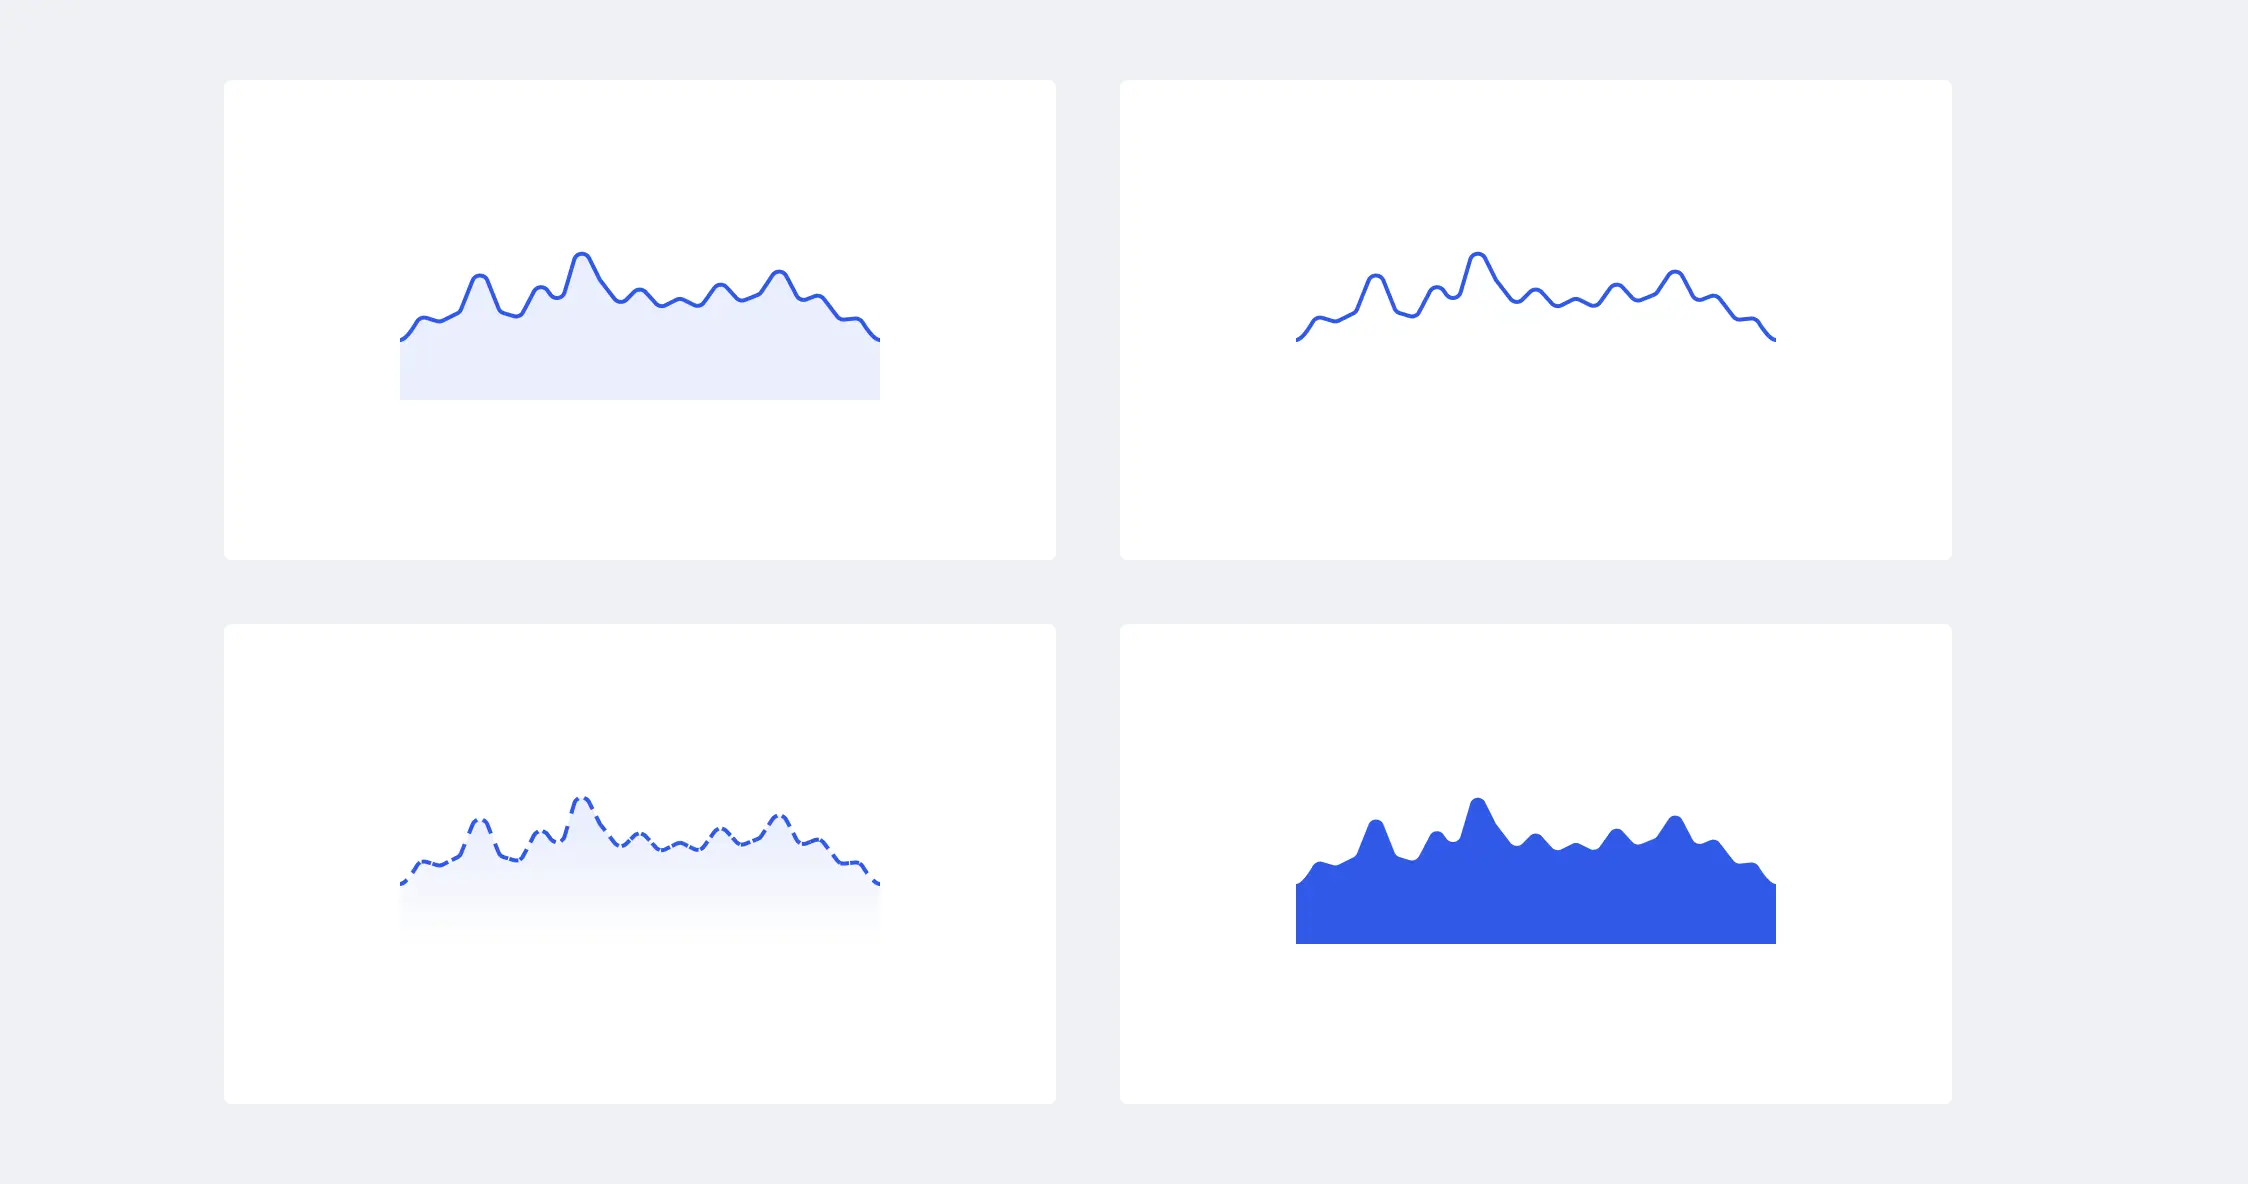
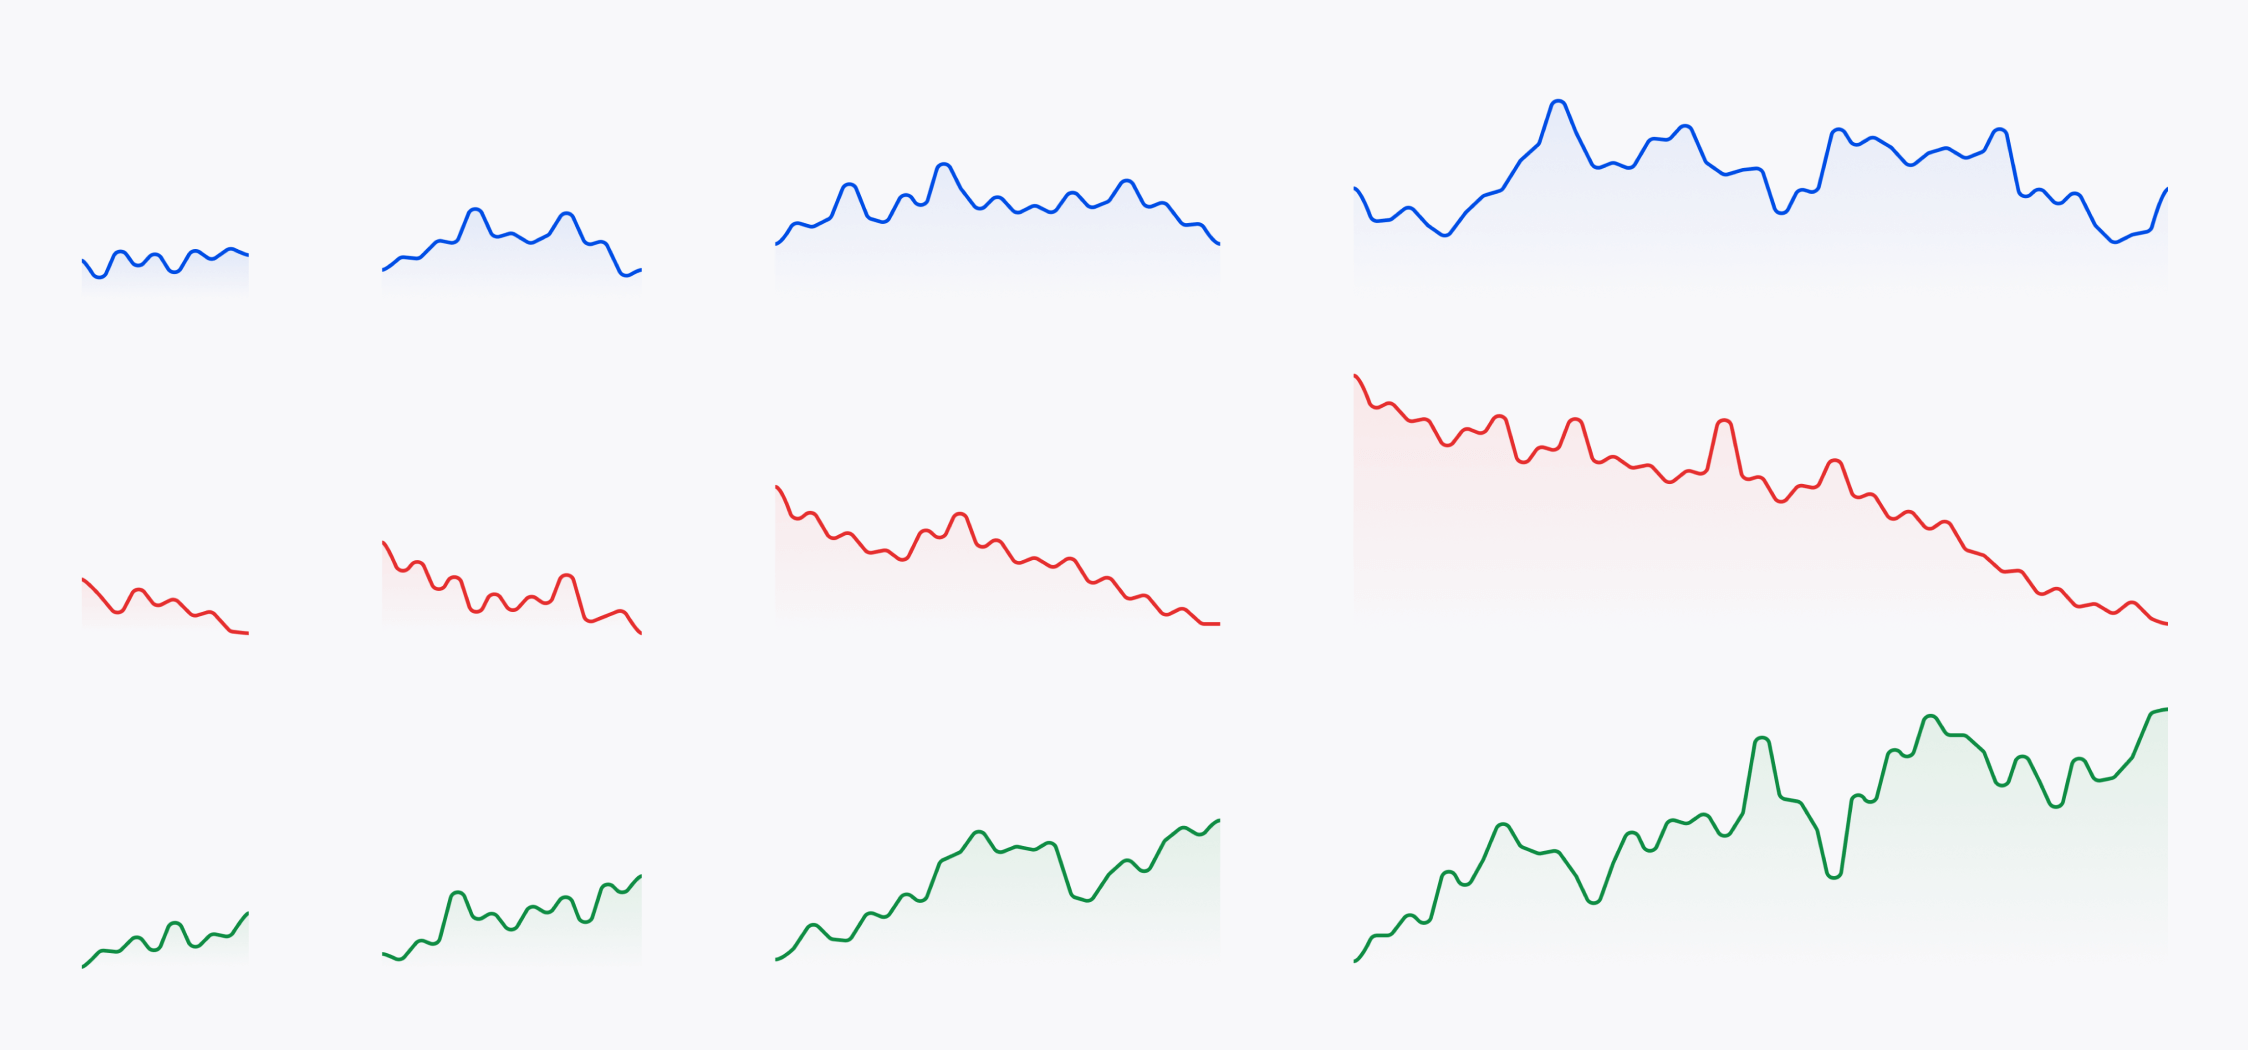
- Enhanced flexibility of the Line Graph component: You can change the line type and manipulate the area.
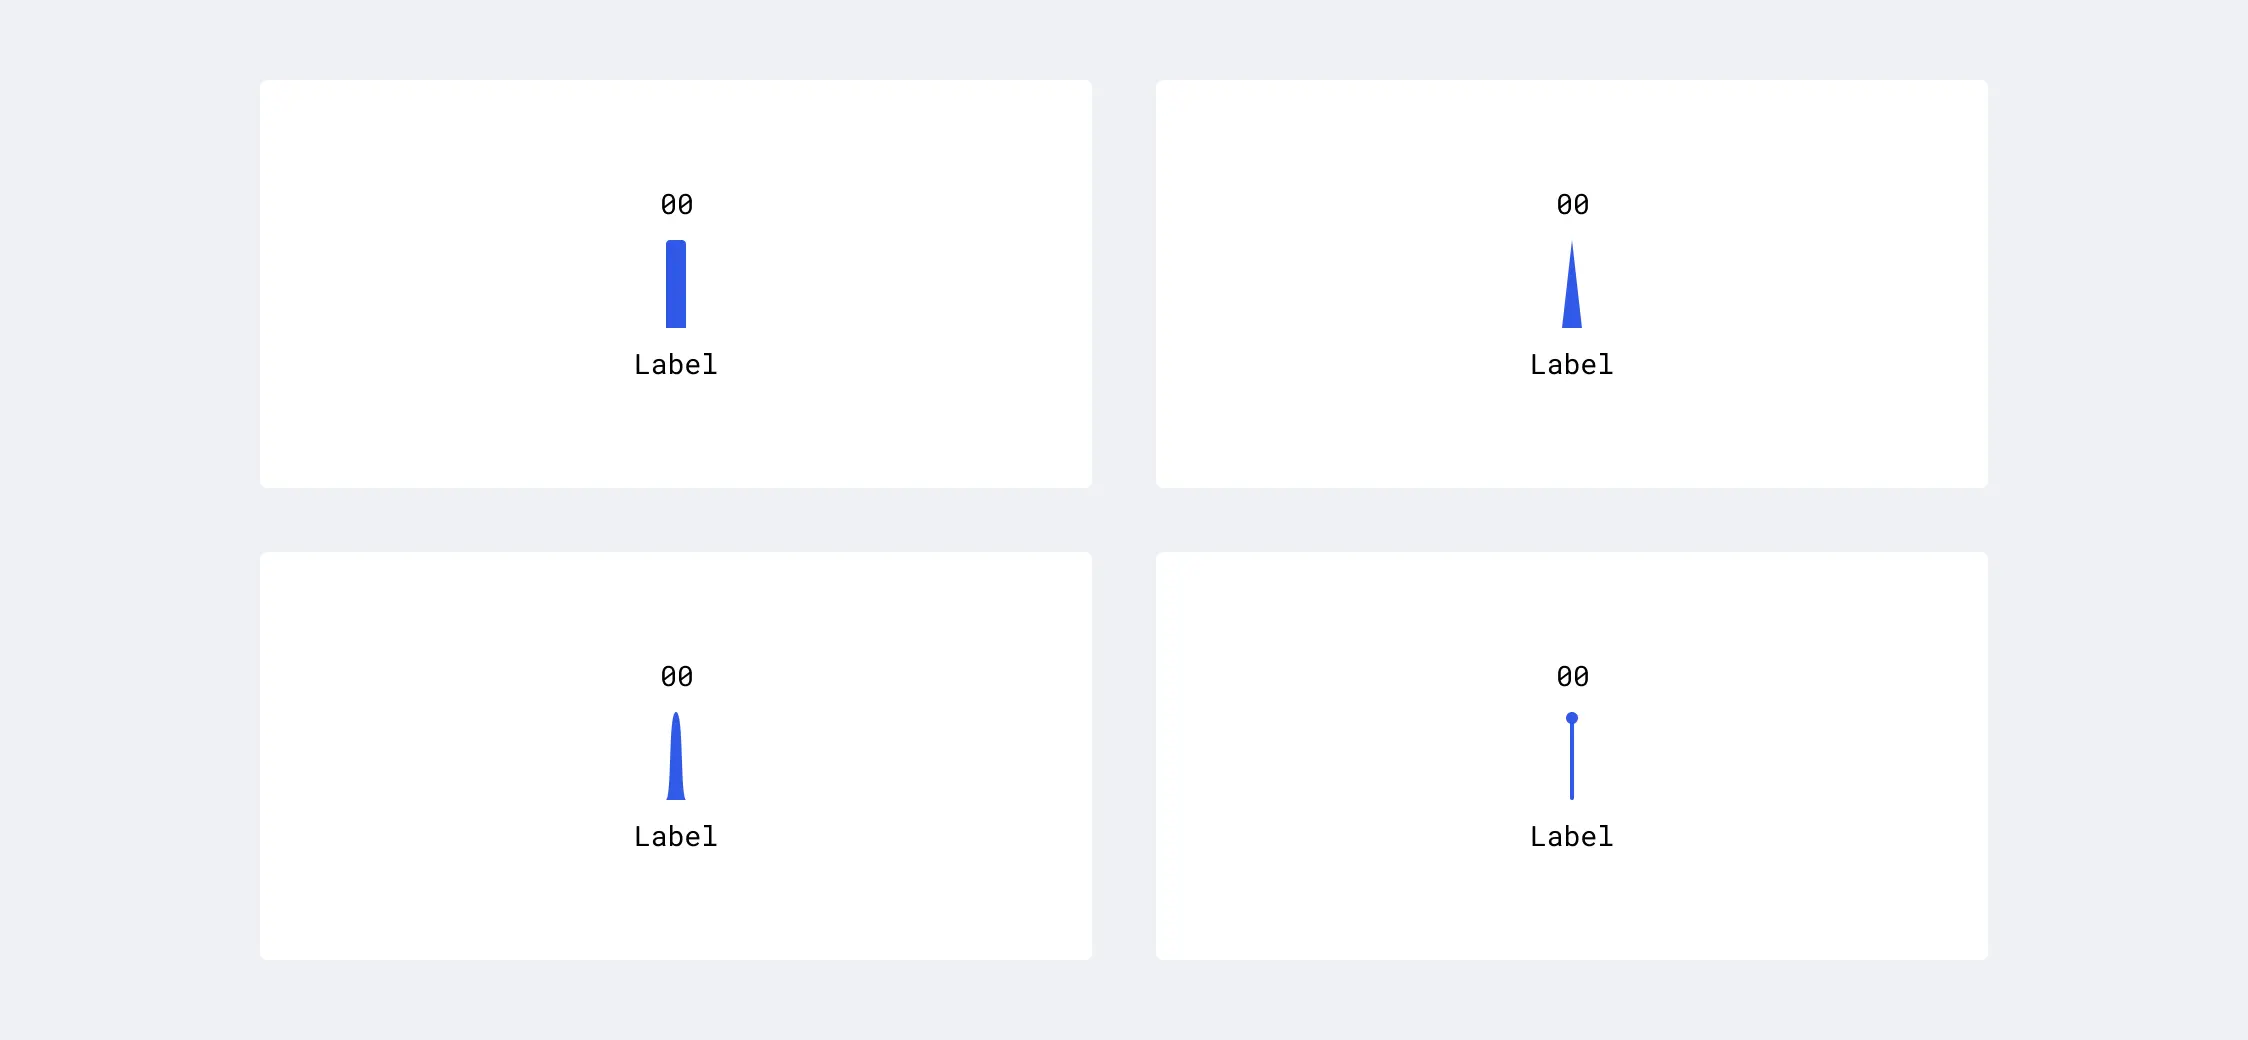
- Enhanced flexibility of the Bar Chart component: You can customize the component style and adjust padding between elements.
- Introduced the Semi Circle type for the Pie and Donut charts.

- Bug fixes & improvements
Aug 14, 2023
Aug 14, 2023
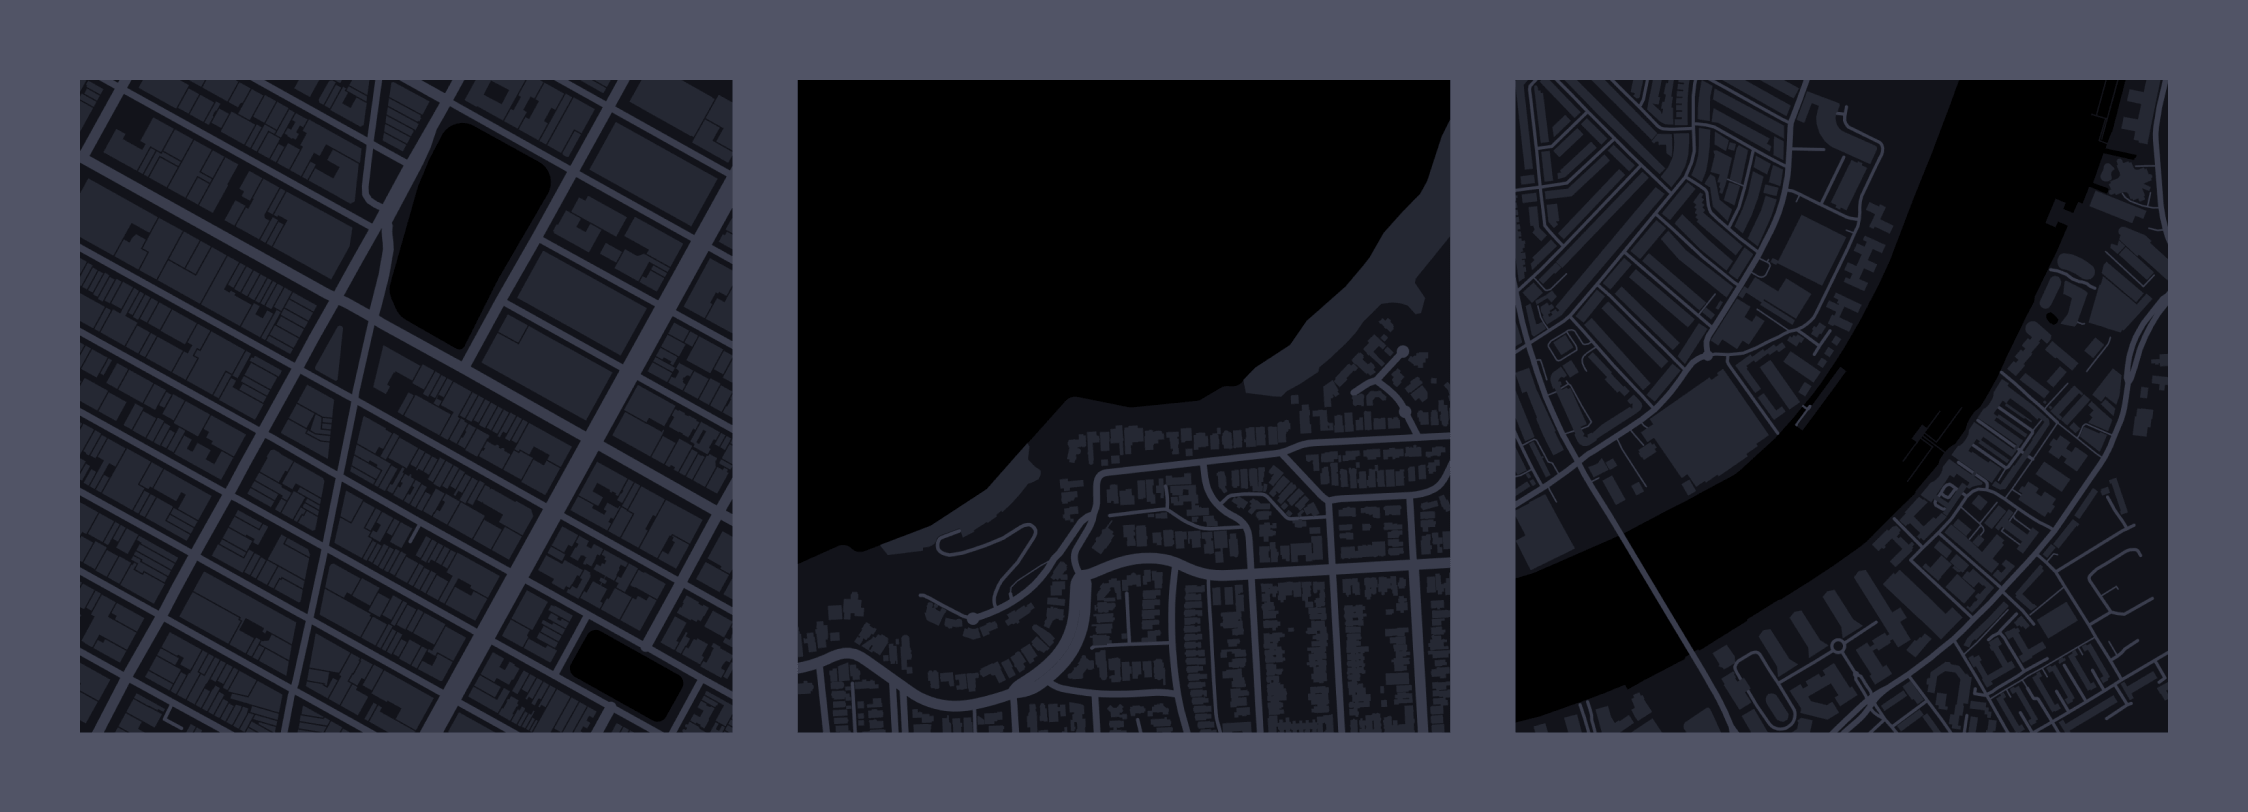
v2.3: Added New Blocks (Dark Theme)
- Added new blocks (Dark Theme)
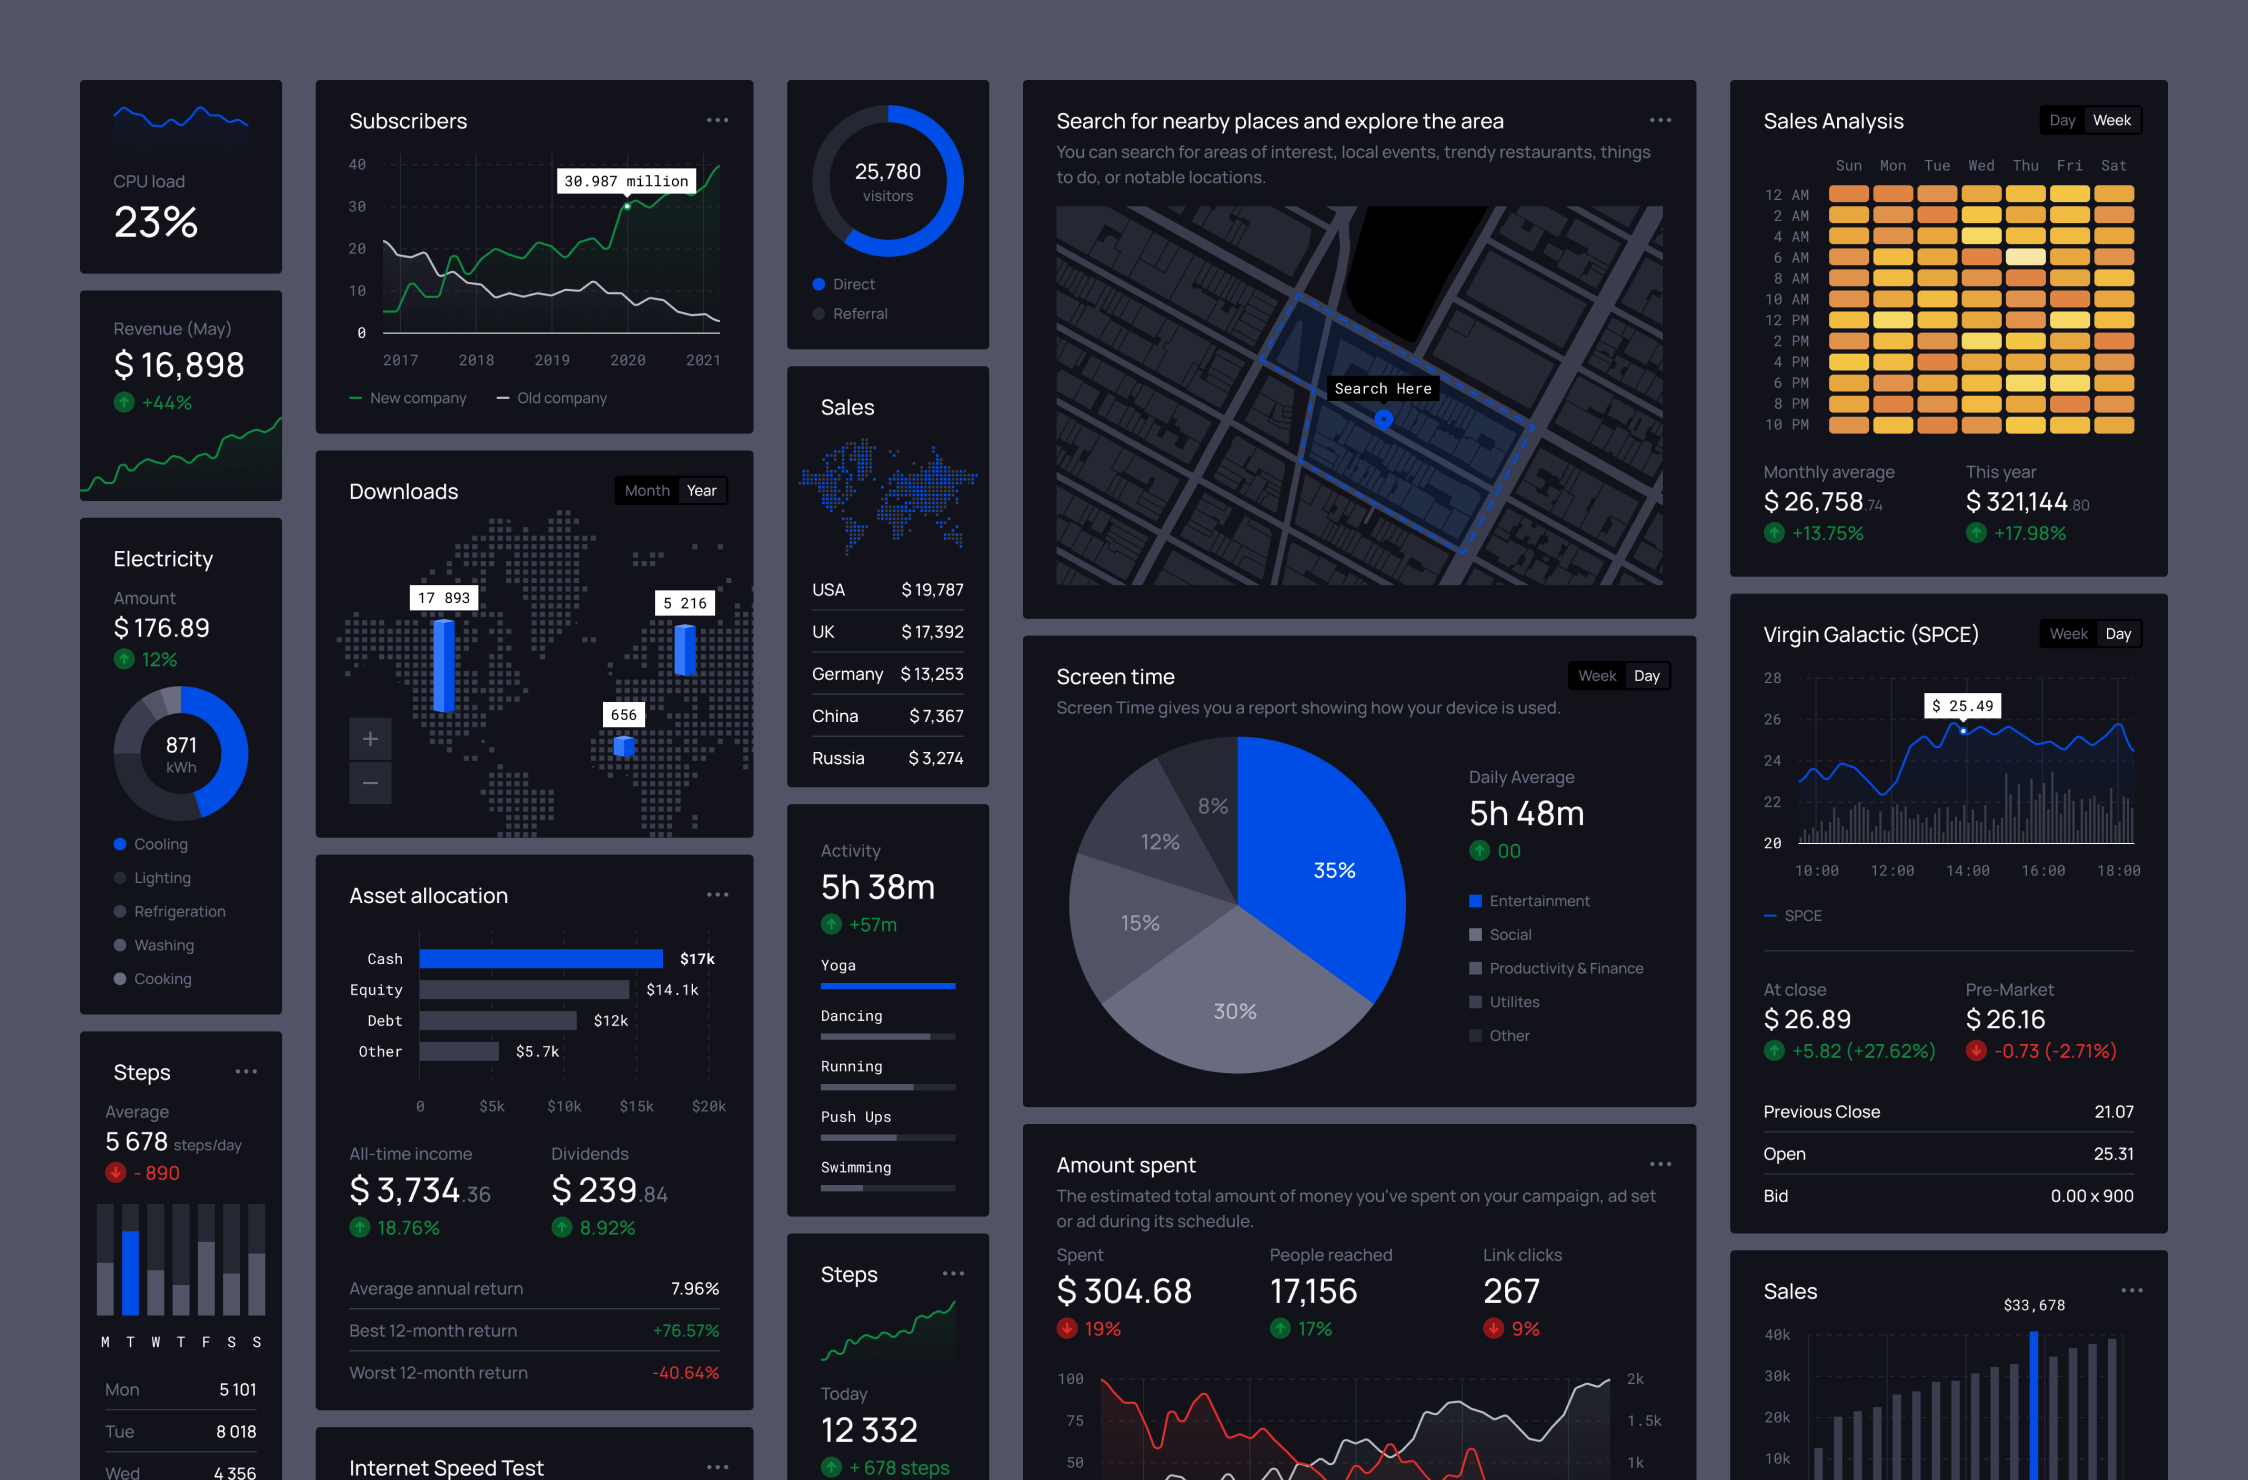
- Added Dark Theme for Cities
- Bug fixes & improvements
Jul 31, 2023
Jul 31, 2023
v2.2: Added Heat Map component and new Line Graphs
- Introducing the Heat Map
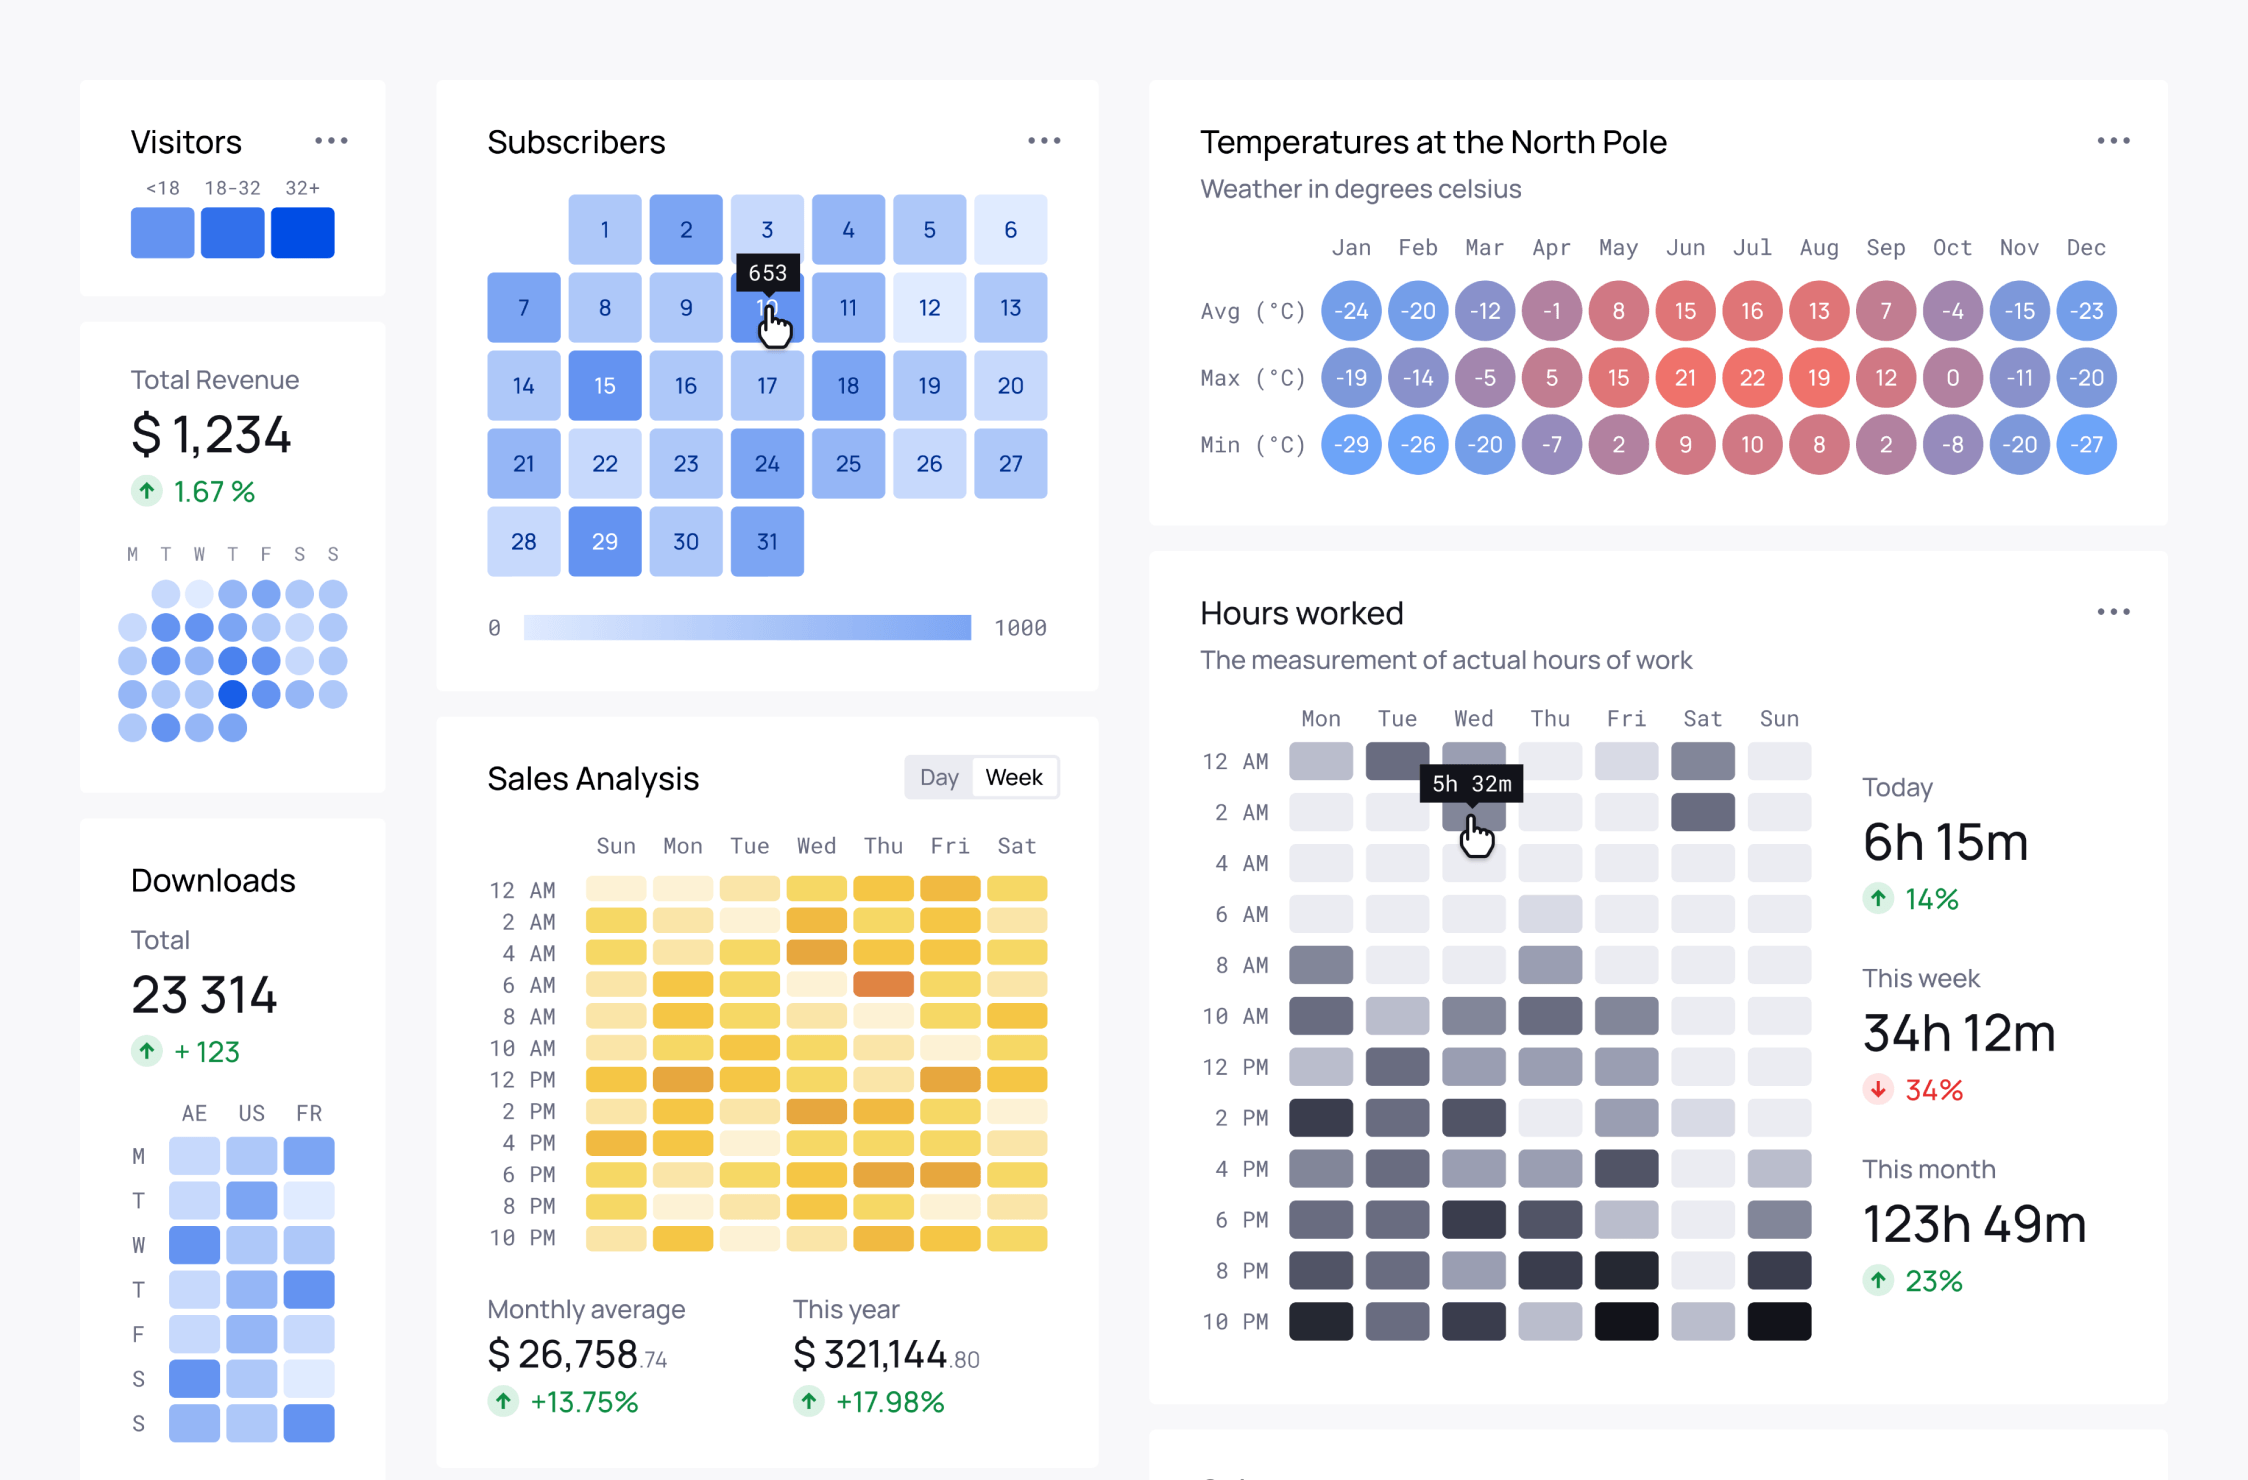
- Added new Line Graphs
- Bug fixes & improvements
Mar 08, 2023
Mar 08, 2023
v2.1: Updated all components
- Updated and Improved all components: Our components can be easily modified for your needs. You can disable one or more elements with just one click.
- Improved color styles
- Bug fixes & improvements
Aug 10, 2021
Aug 10, 2021
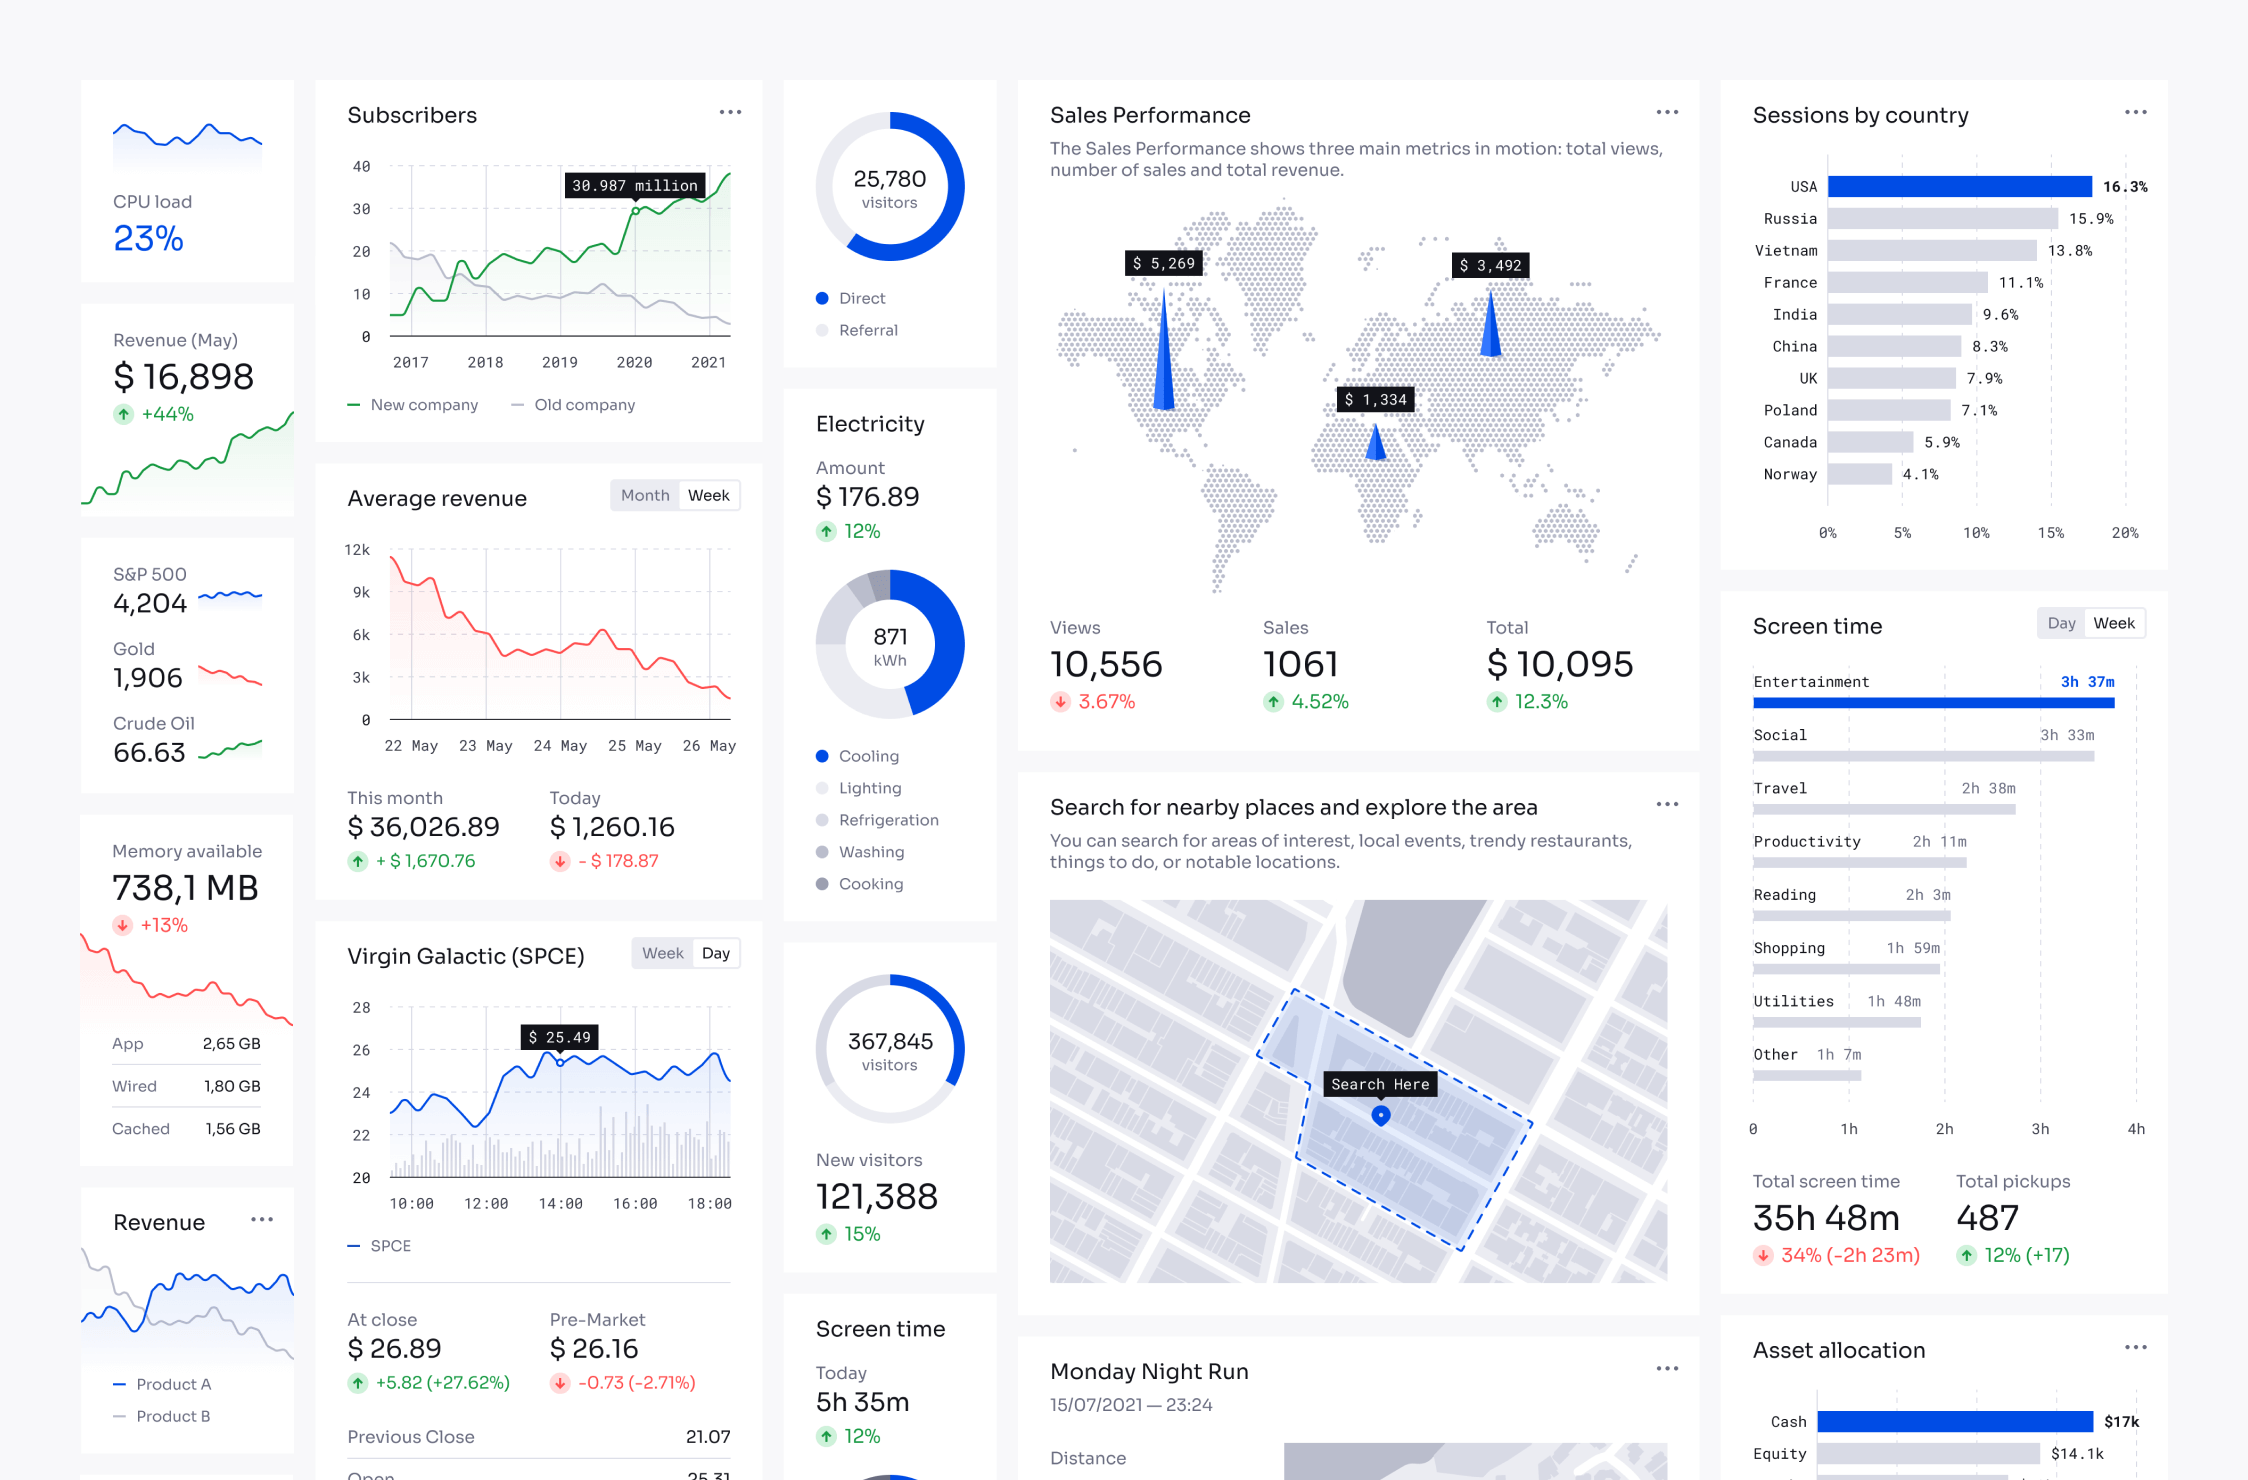
v2.0: Added World and Street maps
- Added World and Street maps
- Bug fixes & improvements
Jun 26, 2021
Jun 26, 2021
v1.0: Released the first version of the product
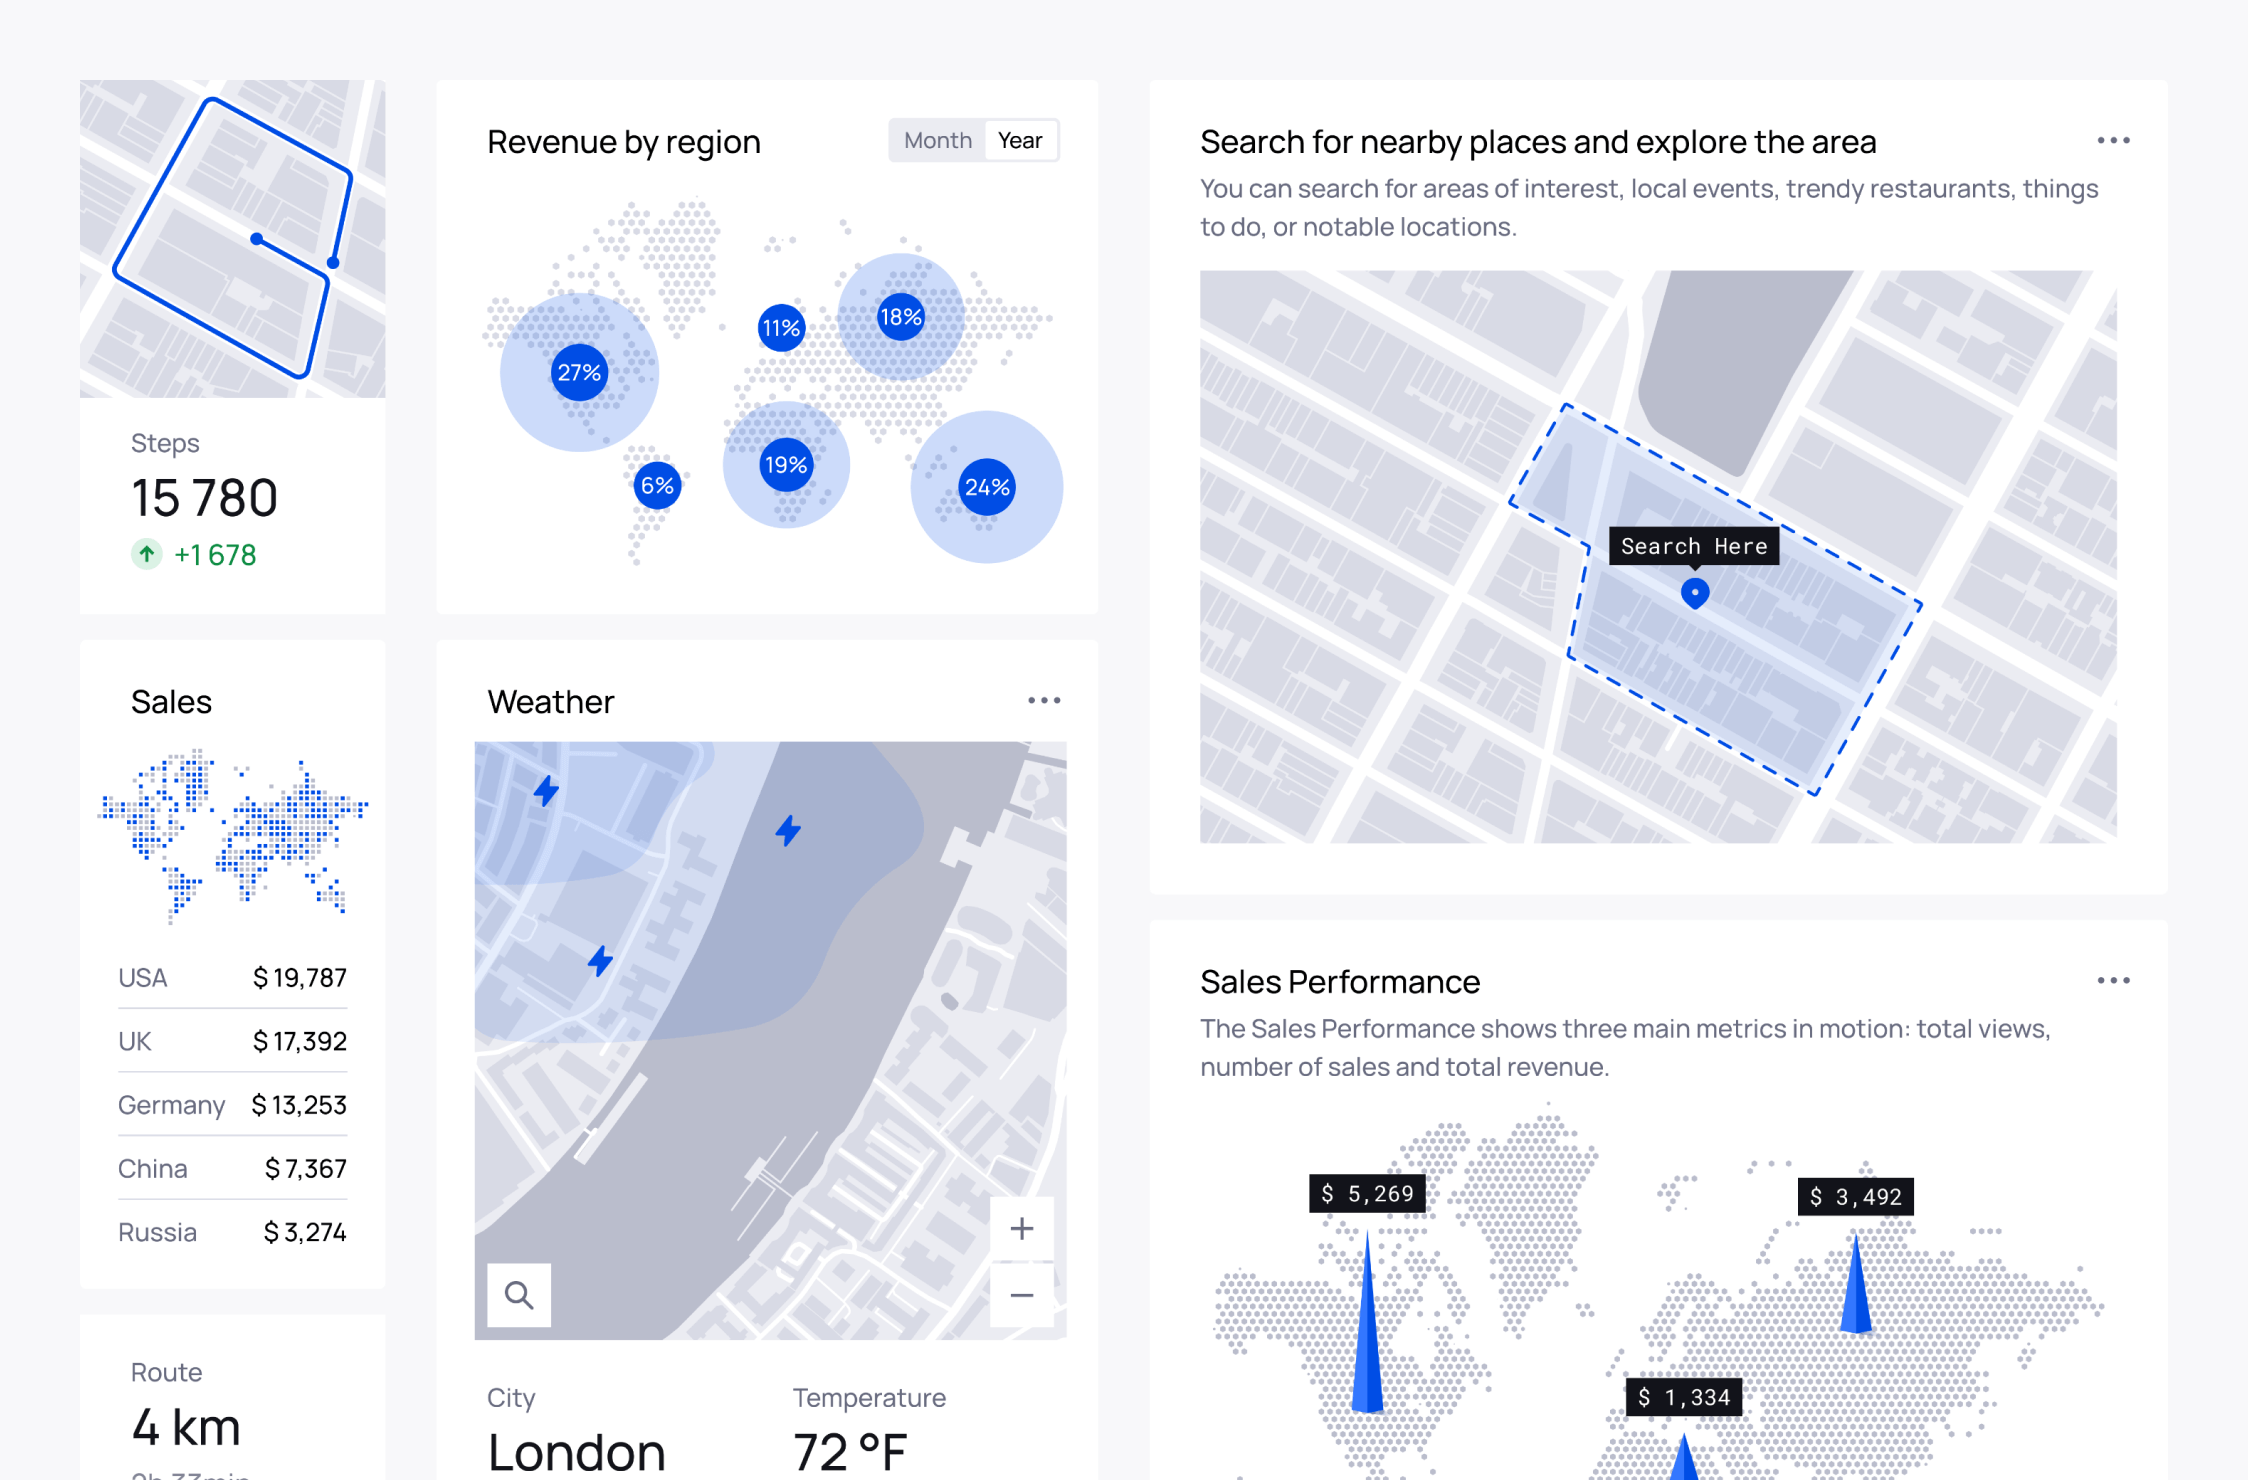
High-quality tool for creating charts and infographics in Figma.


